Monday, May 3, 2010

Manual 6. Tag

[1]Define tag
To add, delete or revise tag definition, Select "Tag" in setting view.


-Add new tag
 Tap "+" button to create new tag.

-Tag detail
 Select tag to see detail or edit.

-Delete category
 Tap "Delete And Change Order" button to start edit mode.
 Also you can swipe left to right (or right to left)  to see "delete" button.

-Change order
 Tap "Delete And Change Order" button to start edit mode.


-Tag name
 This name will be inserted to note when you attach tag to expense.

-Short name 
 This name will shown as label.

-Color
  Label color.


[2]Attach tag to expense
In Edit view. Tap "list"button(see following image) to attach tag.


[3]Analyze expenses using tags
You can look at monthly total amount of tag in "Month history" graph and "Tag" table.


In Search tab, you can filter by tag. 


Manual 5. Budget

There are 2 types of budget.

-Standard budget
 Basically, this budget is applied to all months.

-Special Budget
 This budget is optional and applied to particular month.
 If you make special budget for a month, special budget override  standard budget.


[1]Standard Budget
-Add category
 Tap "+" button to add new category.

-Category detail
 Select category to edit category name and budget.

-Delete category
 Tap "Delete And Change Order" button to start edit mode.
 Also you can swipe left to right (or right to left)  to see "delete" button.

-Change order
 Tap "Delete And Change Order" button to start edit mode.


[2]Category detail
-Category name
 If you change category name, category name of all expenses which are belong to that category will be replaced to new name. Category name of special budget will also change to new name.

-Budget
 Input budget by slider or calculator.


[3]Special budget
-Add new special budget
 Tap "+" button to create new special budget.  And pick month and tap "Done".
 New special budget is copy of standard budget.

-Edit special budget
 Select special budget you want to edit.
 How to edit special budget is same as standard budget.


Budget appears almost every view.
You can see how budget change from month to month in "Monthly History" graph and "Budget" table.


If you don't want to do budget management, you can completely hide budget by setting.
Try "Settings > User Interface > Show Budget".

Manual 4. Search

In seach tab, you can filter expenses by date, amount of money spent, category, name and note(tag) and show list and total.


[1]Search
-Set search option
 Tap one of five options to set option.

-Set order
 Tap "order" to change search result list order.

-Search
 Tap "Search" button to do search.

-Clear
 Tap "Clear" button to default search options.


[2]Search options


[3]Order

Sunday, May 2, 2010

Manual 3. Tables

Table view shows summary of all expenses.


There are 4 sheets. Expenses, Balance, Budget and Tag.
Red cell means expenses over budget.

-Scroll
 You can scroll vertical and horizontal freely.

-Cell detail
 Tap cell to open expense list.


Manual 2. Graphs

4 Types of graphs visualize your expenses.


[1]Select graph type
To select graph, tap right bottom. Then graph type selector will open.

There are 4 graphs.

-Daily history
-Category breakdown
-Category analysis
-Monthly History


[2]Daily history graph
Daily history graph shows how your expenses increase day by day. Also it shows for what and when you spend by photo thumbnails.


-Expense detail
  Touch photo or icon to open bubble.
  Tap photo or icon to go expense detail.

-Daily expense list
  Tap day number to open expense list of a day.
-Change photo size
  Tap left bottom button to open action menu and select one of 4     sizes(Hide, Small, Large or Proportional).

-Mail graph image
  Tap left bottom button to open action menu and select "Mail Graph Image".

-Change month
  Tap "<" or ">" button to shift month. Or tap month title label to go to month list.


-Graph image sample


[3]Category breakdown

Category breakdown graph shows your spending habit.
-Category summary
  A balloon shows a summary of information when you touch a part of the graph.
-Expense list
  An expense list appears when you tap a part of the graph.
-Change month
  Tap "<" or ">" button to shift month. Or tap month title label to go to month list.


[4]Category analysis
Category analysis graph compares budget and expenses for each category.Blue area shows this month's budget. You can know which category you spend too much.

-Category summary  A balloon shows a summary of information when you touch a part of the graph.

-Expense list  An expense list appears when you tap a part of the graph.

-Change month
  Tap "<" or ">" button to shift month. Or tap month title label to go to month list.


[5]Month history
Month history shows how your expenses change month to month.You can compare current expenses to past month.
Blue area shows the category's budget.

-Category summary
  A balloon shows a summary of information when you touch a part of the graph.

-Expense list
  An expense list appears when you tap a part of the graph.

-Change category
  Tap "<" or ">" button to shift category. Or tap category title label to go to category list.


Friday, April 30, 2010

Manual 1. Edit


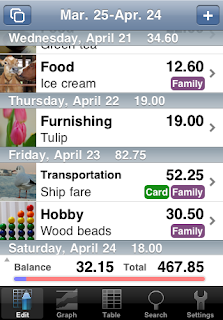
In Edit mode, you can record new expense or revise it.


[1] Expenses list
-Record new expense
 Tap "+" button to go to [2]Expense detail.

-Detail of expense or revise
 Select expense item from list.
 To revise it, tap "Edit" button after you go to next view.

-Delete expense
 Swipe left to right (or right to left) and tap "Delete" button.

-Other month
 To open other month's list, tap top left button. And select month  you want to edit from months list.

-Total expenses and balance
 You always can check those in bottom area. To see more detail information, tap this area.


[2]Expense detail
-Photo
 Tap camera button (or photo) to attach photo.


-Amount of money
 There are two ways to input amount. You can input quickly by slider. If you want to input detail or large amount, please tap number to start calculator.
 You can select maximum value of slider in "setting > user interface".

-Category
 Simply tap to change category.
 You can customize categories in "Settings > standard budget".

-Name 
 There are two ways to input name. You can input name directly in text field. If you want to copy from existing item, tap "list button" next to text field. You can select from existing expense names list.

-Date
 To change date, tap text field.

-Memo
 You can write note in text area.

-Tag
 You can add tag to expense. Please "list button" next to memo area to open tag list. Tag name you select will be added to note.


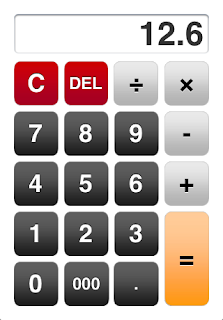
[3]Calculator


When you tap amount of money number, calculator start.
You can input number and calculate.
Then tap "=" button to return to previous view.

You can select "00" or "000" key in "Settings > User Interface".


Thursday, April 29, 2010

ExpenseBook -budget viewer

"ExpenseBook" focuses on controlling expenses and keeping a budget.
Expenses are very easy to input and they show up immediately on your budget. 
"ExpenseBook" gives you useful information to control expenses through graphs, a table and a filtering tool which are easy to understand and enjoyable to look at. 
It is also very easy to attach a photo to any expense. 
Have fun recording and control your expenses with "ExpenseBook". 

Functions
-Budget
 -able to customize categories by using add, delete and reorder functions.
 -able to assign a budget for any category (food, clothing,etc.)
 -able to make a special budget for particular month that is different from standard budget. 

-Input
 -functions to quickly input an expense name, a category, an amount of money and note.
 -slider to input money -calculator to input money.
 -one touch category selector
 -reuse names from the history list
 -clone expense items
 -divide expense items

-Photos
 -attach a photo to an expense.
   You can attach a photo of receipt and look at it later.
 -photos are shown within graphs to make the graph easy to understand and fun.

-Graphs
 (1)The line layer graph can show how expenses change from day to day.
   You can see how expenses increase from day to day and this will help you save money.
 (2)The bar graph shows expenses vs budget for each categories.
   You can see which category you spend too much.
 (3)The circle graph shows a monthly breakdown of expenses.
   You can easily compare spending habits by category.
 (4)The bar graph shows how your expenses change from month to month.
   You can compare current expenses to past months.
 Each graphs is touchable
 -a balloon shows a summary of information when you touch a part of the graph.
 -an expense list appears when you tap a part of the graph.

-Table
 -a summary of all expenses on one sheet.

-Attaching Tags and Filtering
 -filtering by date, amount of money spent, category, name and note.
 -attaching tags make it easy to filter for a particular purpose.
  For example, you can use it to list credit card charges, to list up wasts etc.

-Sharing data
 -send CSV file by email
 -send detail of expense with photo by email
 -send daily history graph image

-Screen shots